
Staying up to date on all the latest election news using the Aiven for Grafana plugins
While it can be overwhelming to stay up on the latest news or events — putting all the details in one dashboard can help you maintain some sense of sanity in this information-overload era.

The Fall season is upon us. You can hear the sound of leaves crunching on the ground beneath your feet and the smell of pumpkin spice lattes in every Starbucks corner. Since the US midterm elections are coming closer, you're bombarded with calls from polling groups and political flyers at every turn.
While it can be overwhelming to stay up on the latest news or events — putting all the details in one dashboard can help you maintain some sense of sanity in this information-overload era.
Using Aiven for Grafana plugins to create the dashboard of your dreams.
Grafana is a way of visualizing data and providing a single source of truth for individuals working on a project. It is currently of the most popular open-source projects on GitHub, with over 51.8K stars + 10.2K forks of the original project.
Together — Aiven for Grafana can help you tie together metrics and data from multiple platforms to help you understand what's happening across the various systems within your organization. Check out all of the new plugins available for Aiven for Grafana here.
Getting Started
Today we'll be exploring the new features of what you can create with the Aiven for Grafana plugins by creating a dashboard. You can get started with these tools by following these how-to docs. If you're new to Grafana as well — don't fret, check out these great tutorials from the Grafana Labs team, here.
We'll be comparing different datasets side by side, as well as leveraging the RSS feed reader visualization to create our own personal election dashboard using these tools.
Today's Mission
Let's explore how one might use these tools and why they might be a great fit for your team through creating our own 2022 election news dashboard using Aiven for Grafana.
You can add in any datasets that you like to follow, but here are a few that I enjoyed playing around with as I was building my dashboard:
- United States Government Bill Status Repo
- WTFJHT: A Daily Update of What the F*** Just Happened Today
- News Homepages
- Local Election Results
- MIT Election Data and Science Lab
Let's geek out together!
Admittedly, I'm a bit of a geek in open-source journalism and datasets, and I love what people build off of them. But one problem remains — when you're reporting all over the country at different points in time, and folks could very much be looking at different data sets processed differently, things can get messy!
By having one dashboard that the entire team is looking at (even if that team is just uhh... one geeky journalist turned developer educator 🤓😅), you can make sure that your data is truthful, up to date, and filled with integrity — every step of the way.
Time to get this (data) party started 😎
We'll kick off this process by first setting up our Aiven instance — for the sake of today; we'll go ahead and create a new service of your choosing, then set up a new Grafana dashboard from that information.
(PS — new to the world of managed cloud databases? Don't be scared! Aiven makes great guides to get started here.)
Aiven thrives at handling data — and a lot of it — and combined with the power of Grafana, that data now becomes easily manageable with customizable views and visualizations.
Once you set up the Grafana service integration via the Aiven Console, you'll next want to add in the data sets of your choosing. Grafana supports many different data sources, so you can find what works best for you + your organization.
I'll be leveraging GitHub, JSON files, Google Sheets Data (pulled from election history), and RSS Feeds all within my dashboard to make it my dream database.
On the home page of the Grafana service integration — you'll be able to add in whatever dataset however you like. Additionally — if you're stuck, Grafana provides great examples on how you can get started with the data set at hand.
Quick pro-tip — remember, data is great, but it's only one part of the story. How the data is interpreted and displayed is just as important! 😉
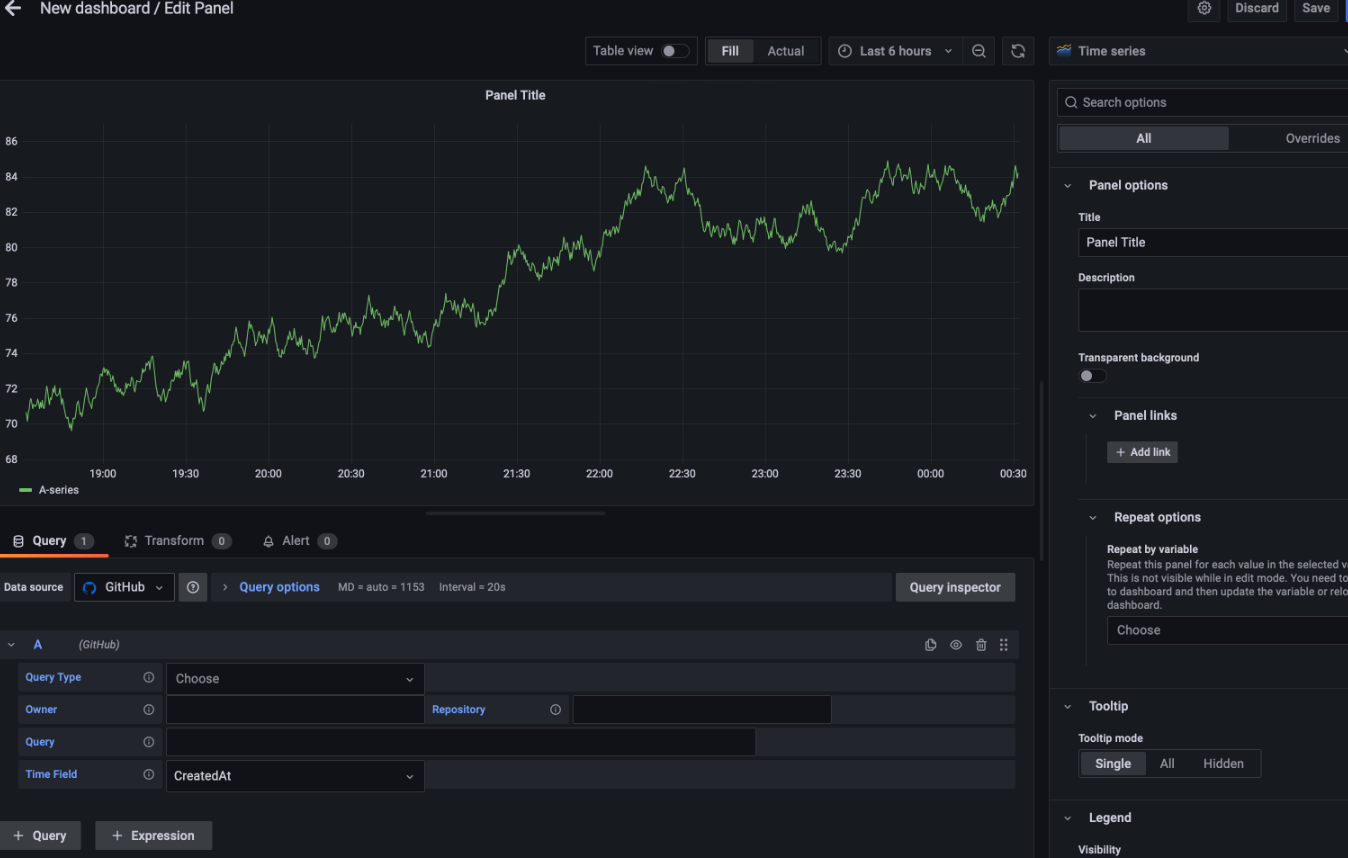
Here's a preview of how Grafana recommended for me to display GitHub data.
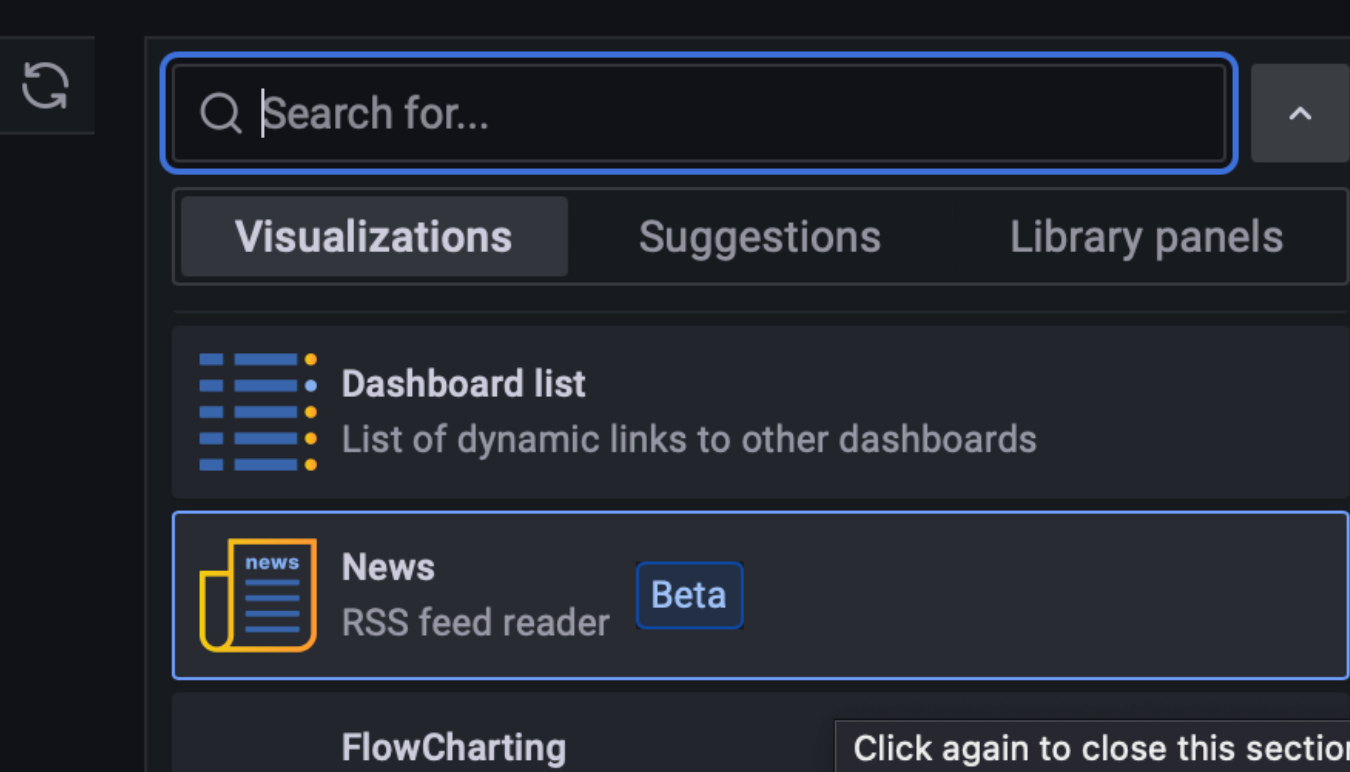
Additionally, you'll be able to add supplementary resources or text as you'd like on your Grafana dashboard. From RSS readers, added markdown text, or even just adjusting the colors of the display, these little details can go a long way in helping you tell an informed story.
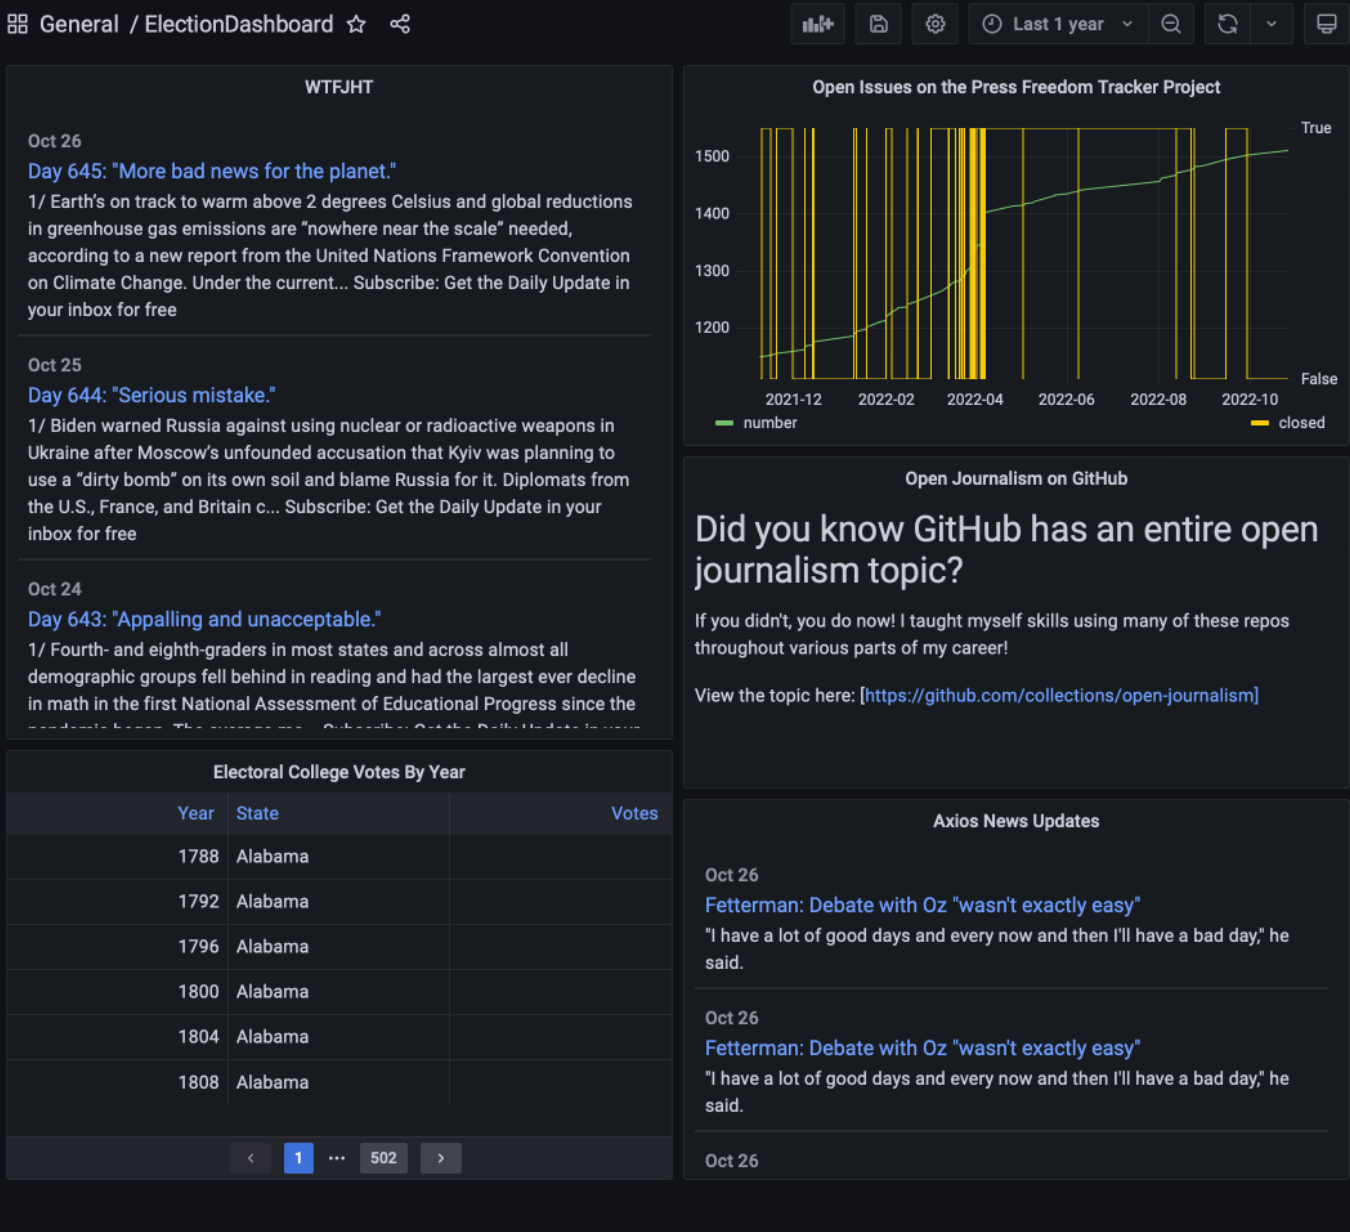
After you've got it all together — Don't be afraid to show it off! After some time playing around with it, this is the final election dashboard that I came up with!
Featuring data on electoral colleges, how different states are currently polling, and even tracking open issues to the Press Freedom Tracker project I have volunteered time with previously.
Election dashboards today... keeping tabs on your infrastructure tomorrow
While this is a fun starter project to familiarize yourself with the Aiven for Grafana plugins, it's far from the only possibility. With partners such as Digital Ocean, Google Cloud, Azure, and so many more — this tech stack means business.
How else could you use these tools?
Whether you're geeking out over open-source election datasets or need a real-time dashboard to stay on top of all of the odds and ends of your operations — we've got the tools to make it happen.
Many of these features in the Aiven for Grafana plugins are designed to enhance your monitoring and observability abilities. From alerts, real-time streaming, usage insights, and uptime monitoring — there is bound to be something for you